Published Papers
Smartphone Google Location History: A Novel Approach to Outdoor Physical Activity Research
Background:Outdoor physical activity (PA) is an important component of overall health; however, it is difficult to measure. Passively collected smartphone location data like Google Location History (GLH) present an opportunity to address this issue. Objectives: To evaluate the use of GLH data for measuring outdoor PA.
Methods:
We collected GLH data for 357 individuals from the Washington State Twin Registry. We first summarized GLH measurements relevant to outdoor PA. Next, we compared accelerometer measurements to GLH classified PA for a subset of 25 participants who completed 2 weeks of global positioning system and accelerometer monitoring. Finally, we examined the association between GLH measured walking and obesity.
Results:
Participants provided a mean (SD) average 52 (18.8) months of GLH time-activity data, which included a mean (SD) average of 2421 (1632) trips per participant. GLH measurements were classified as the following: 79,994 unique walking trips (11.6% of all trips), 564,558 (81.8%) trips in a passenger vehicle, 11,974 cycling trips (1.7%), and 890 running trips (0.1%). Sixty-two percent of these trips had location accuracy >80%. In the accelerometry evaluation, GLH walking trips had a corresponding mean vector magnitude of 3150 counts per minute, compared with 489 counts per minute for vehicle trips. In adjusted cross-sectional analyses, we observed an inverse association between both walking minutes and trips per month and the odds of being obese (odds ratio = 0.78; 95% CI, 0.60–0.96, and odds ratio = 0.91; 95% CI, 0.82–0.98, respectively).
Conclusions:
GLH data provide a novel method for measuring long-term, retrospective outdoor PA that can provide new opportunities for PA research.
Full Manuscript: https://journals.humankinetics.com/view/journals/jpah/22/3/article-p364.xml
Use of individual Google Location History data to identify consumer encounters with food outlets
Background:
Addressing key behavioral risk factors for chronic diseases, such as diet, requires innovative methods to objectively measure dietary patterns and their upstream determinants, notably the food environment. Although GIS techniques have pushed the boundaries by mapping food outlet availability, they often simplify food access dynamics to the vicinity of home addresses, possibly misclassifying neighborhood effects. Leveraging Google Location History Timeline (GLH) data offers a novel approach to assess long-term patterns of food outlet utilization at an individual level, providing insights into the relationship between food environment interactions, diet quality, and health outcomes.
Methods:
We leveraged GLH data previously collected from a sub-set of participants in the Washington State Twin Registry (WSTR). GLH included more than 287 million location records from 357 participants. We developed methods to identify visits to food outlets using outlet-specific buffer zones applied to the InfoUSA data on food outlet locations. This methodology involved the application of minimum and maximum stay durations, along with revisit intervals. We calculated metrics from the GLH data to detect frequency of visits to different food outlet classifications (e.g. grocery stores, fast food, convenience stores) important to health. Several sensitivity analyses were conducted to examine the robustness of our food outlet metrics and to examine visits occurring within 1 and 2.5 km of residential locations.
Results:
We identified 156,405 specific food outlet visits for the 357 study participants. 60% were full-service restaurants, 15% limited-service restaurants, and 16% supermarkets. Mean visits per person per month to any food outlet was 12.795. Only 8, 10 and 11% of full-service restaurants, limited-service restaurants, and supermarkets, respectively, occurred within 1 km of residential locations.
Conclusions:
GLH data presents a novel method to assess individual-level food utilization behaviors.
Full Manuscript: https://link.springer.com/article/10.1186/s12942-025-00387-w
Bring Your Own Location Data: Use of Google Smartphone Location History Data for Environmental Health Research
Background:
Environmental exposures are commonly estimated using spatial methods, with most epidemiological studies relying on home addresses. Passively collected smartphone location data, like Google Location History (GLH) data, may present an opportunity to integrate existing long-term time–activity data.
Objectives:
We aimed to evaluate the potential use of GLH data for capturing long-term retrospective time–activity data for environmental health research.
Methods:
We included 378 individuals who participated in previous Global Positioning System (GPS) studies within the Washington State Twin Registry. GLH data consists of location information that has been routinely collected since 2010 when location sharing was enabled within android operating systems or Google apps. We created instructions for participants to download their GLH data and provide it through secure data transfer. We summarized the GLH data provided, compared it to available GPS data, and conducted an exposure assessment for nitrogen dioxide (NO2) air pollution.
Results:
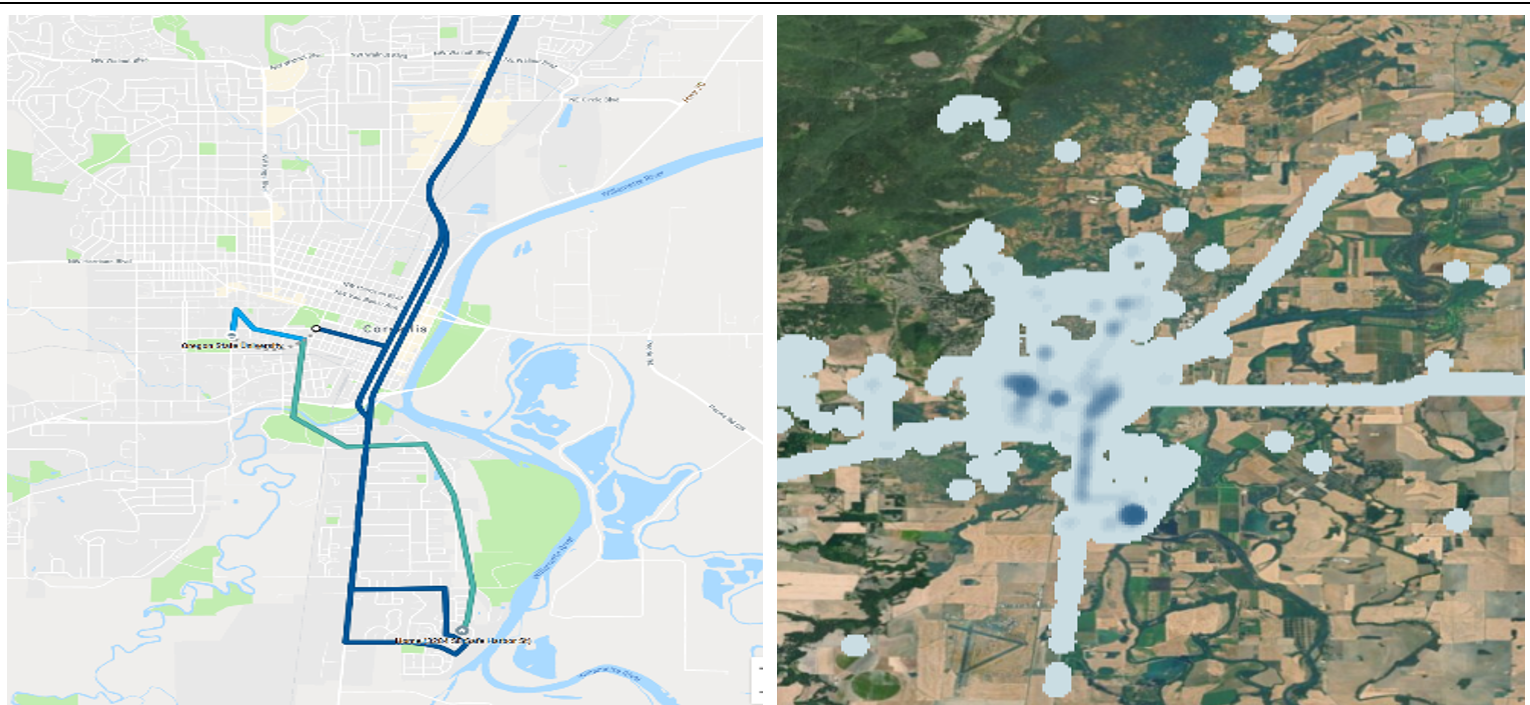
Of 378 individuals contacted, we received GLH data from 61 individuals (16.1%) and 53 (14.0%) indicated interest but did not have historical GLH data available. The provided GLH data spanned 2010–2021 and included 34 million locations, capturing 66,677 participant days. The median number of days with GLH data per participant was 752, capturing 442 unique locations. When we compared GLH data to 2-wk GPS data (∼1.8 million points), 95% of GPS time–activity points were within 100m of GLH locations. We observed important differences between NO2 exposures assigned at home locations compared with GLH locations, highlighting the importance of GLH data to environmental exposure assessment.
Discussion:
We believe collecting GLH data is a feasible and cost-effective method for capturing retrospective time–activity patterns for large populations that presents new opportunities for environmental epidemiology. Cohort studies should consider adding GLH data collection to capture historical time–activity patterns of participants, employing a “bring-your-own-location-data” citizen science approach. Privacy remains a concern that needs to be carefully managed when using GLH data. https://doi.org/10.1289/EHP10829
Full Manuscript: https://pmc.ncbi.nlm.nih.gov/articles/PMC9648904/
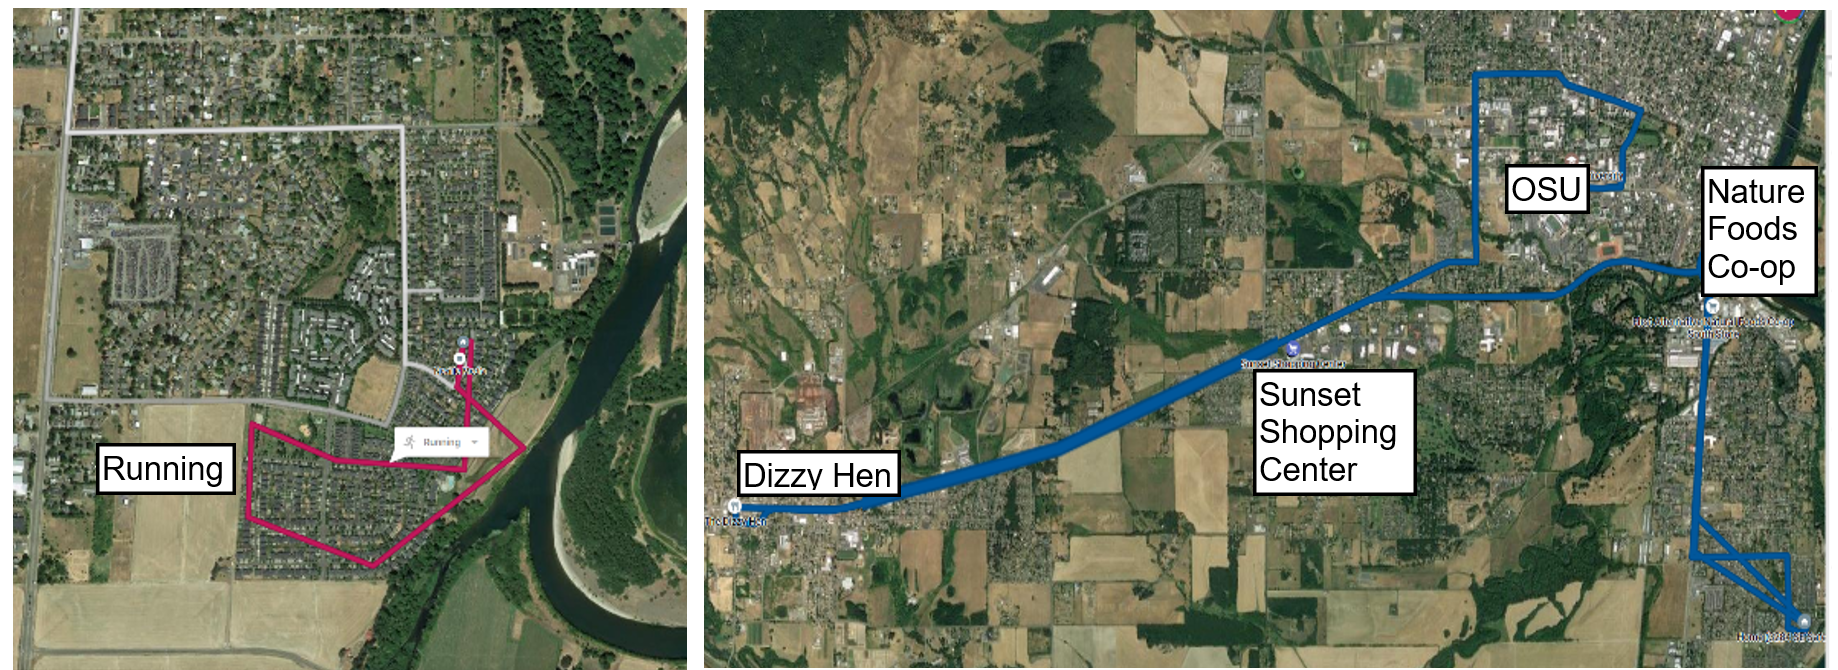
Example of GTL data coverage for one individual
Temporal coverage of GTL data provided by 61 individuals. Each colored box represents the percentage of individuals who had data for the given day. In 2019 and 2020, almost 60% of the individuals had data for everyday of the year.

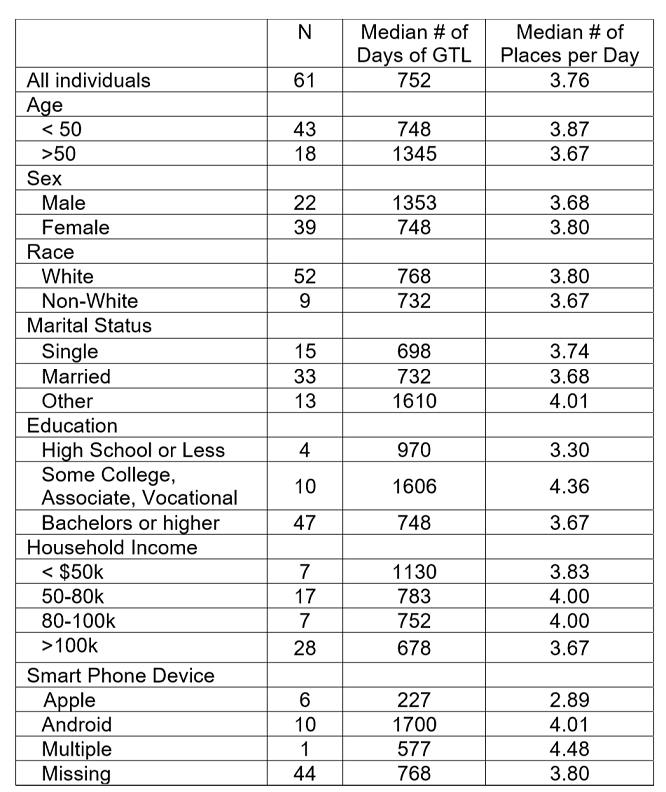
Differences in GTL coverage, measured using median number of days and places per day of data, by key individual, geographic and smart phone device characteristics
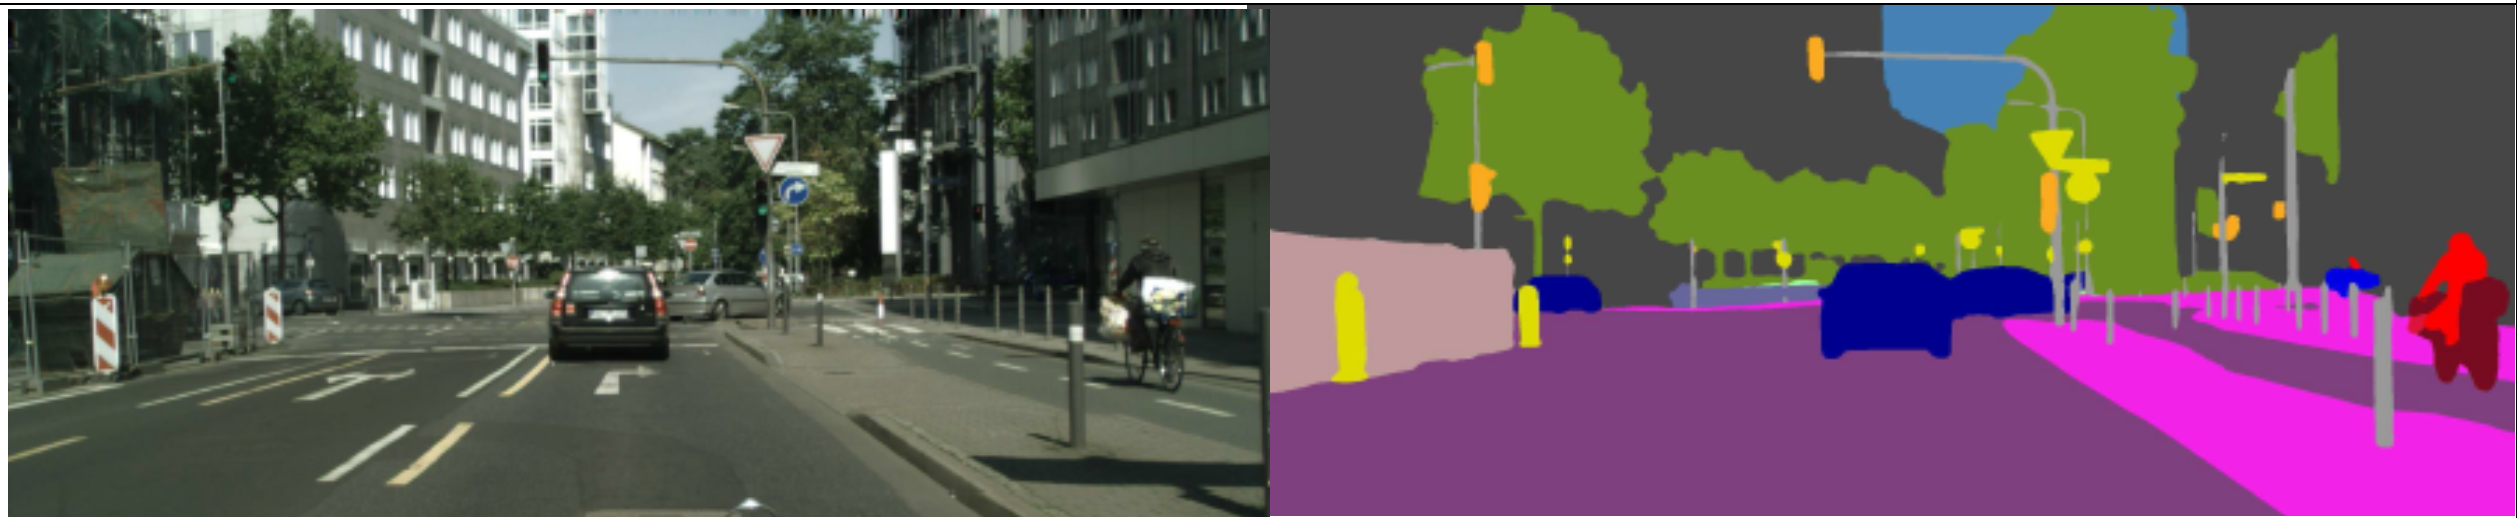
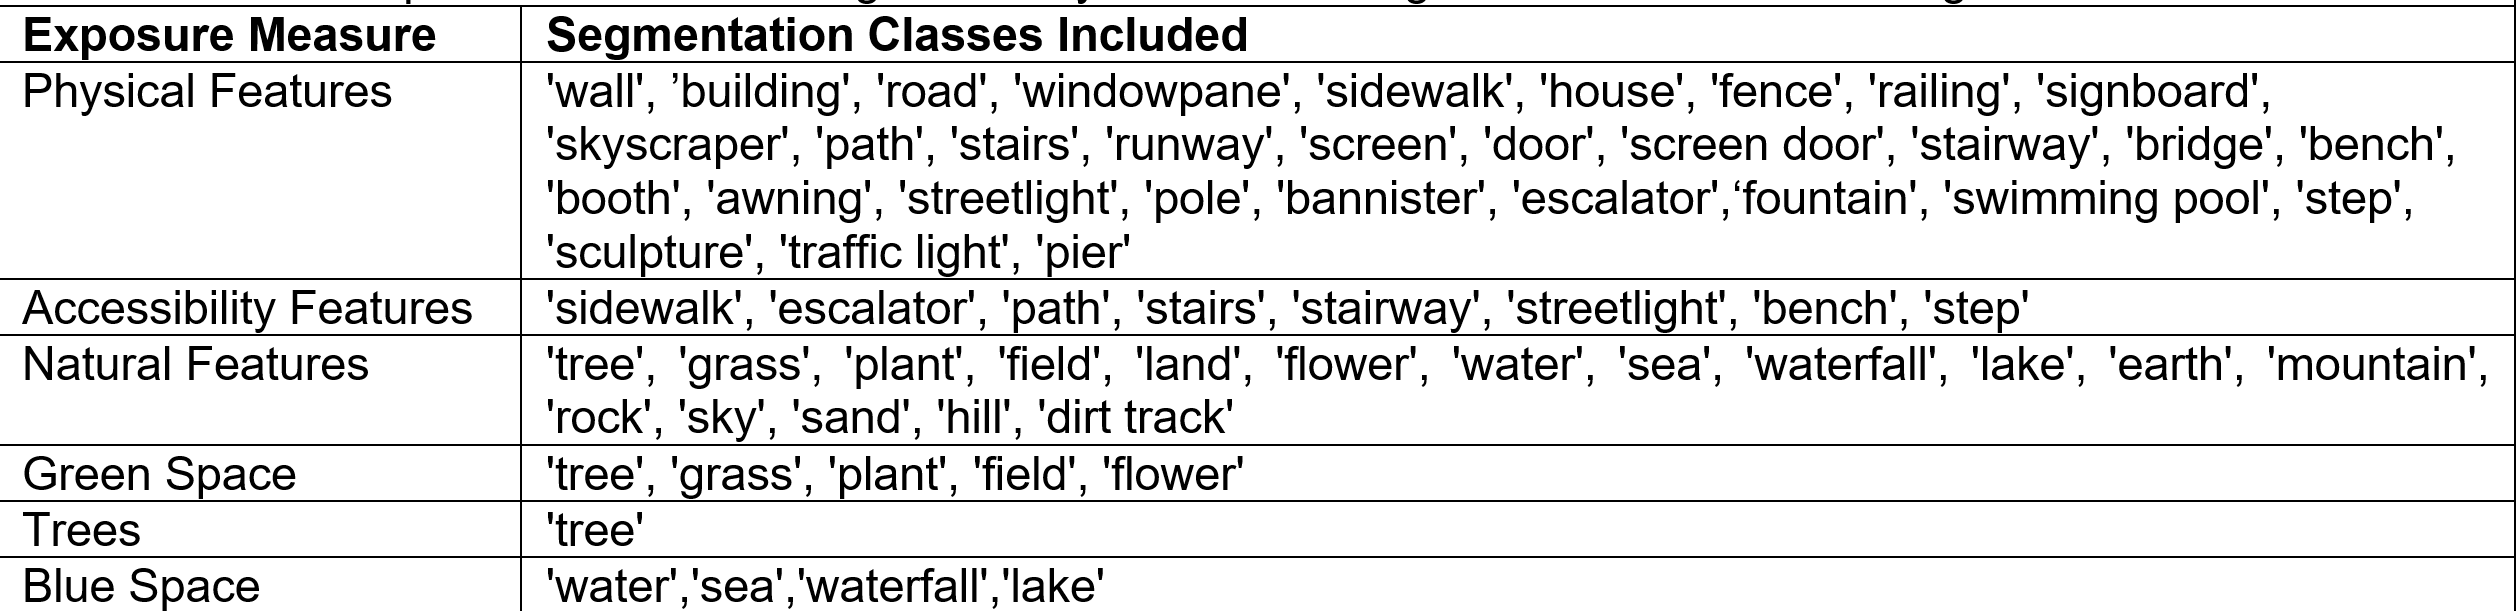
Deep Learning of Street View Imagery to assess the built enviroment
Segmentation of GSV image (left) and segmented features with trees in green (right). For major built env. features the prediction accuracy is >95%